
IDX-Listed Tech Companies Just Delivered Their Most Profitable Quarter, with GoTo’s First Net Profit Landing at IDR 171B
Six Indonesian companies (four listed, two pre-IPO) reported results in the same 90-day window pointing in the same direction.
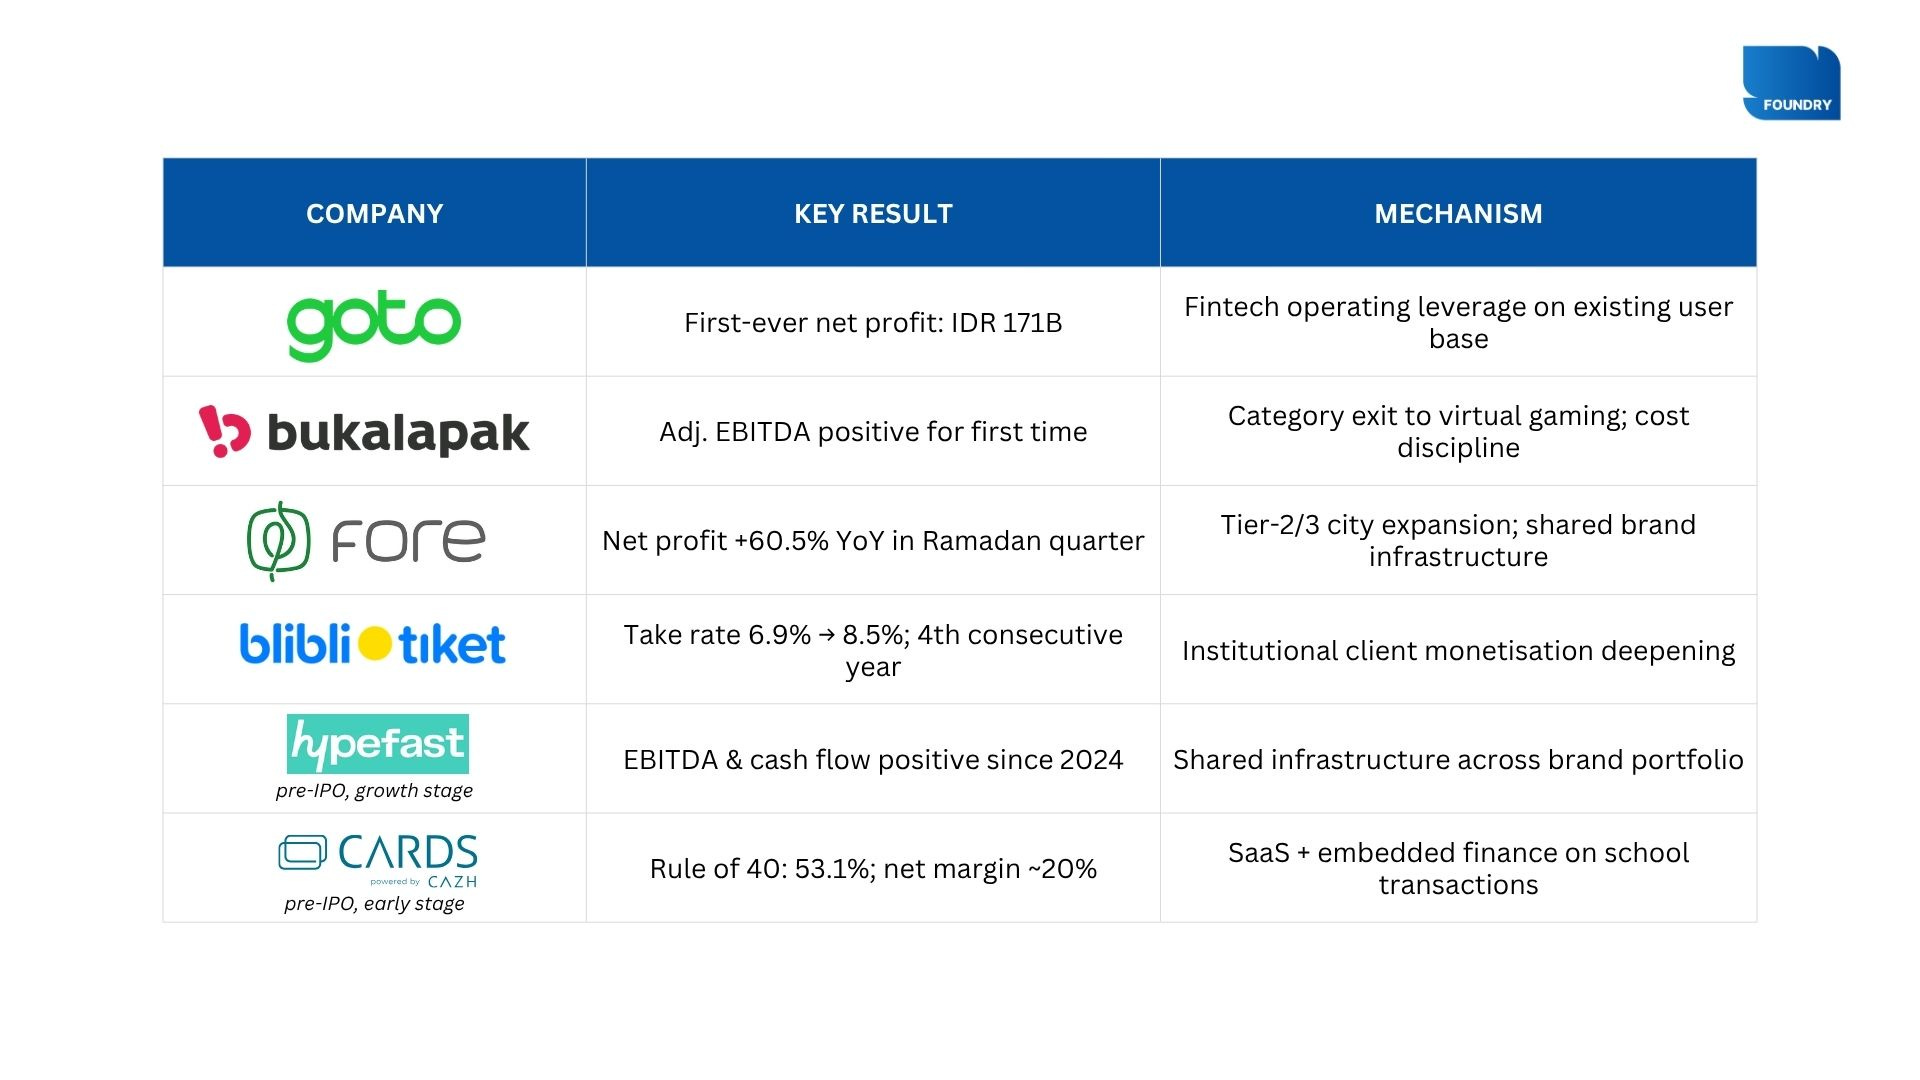
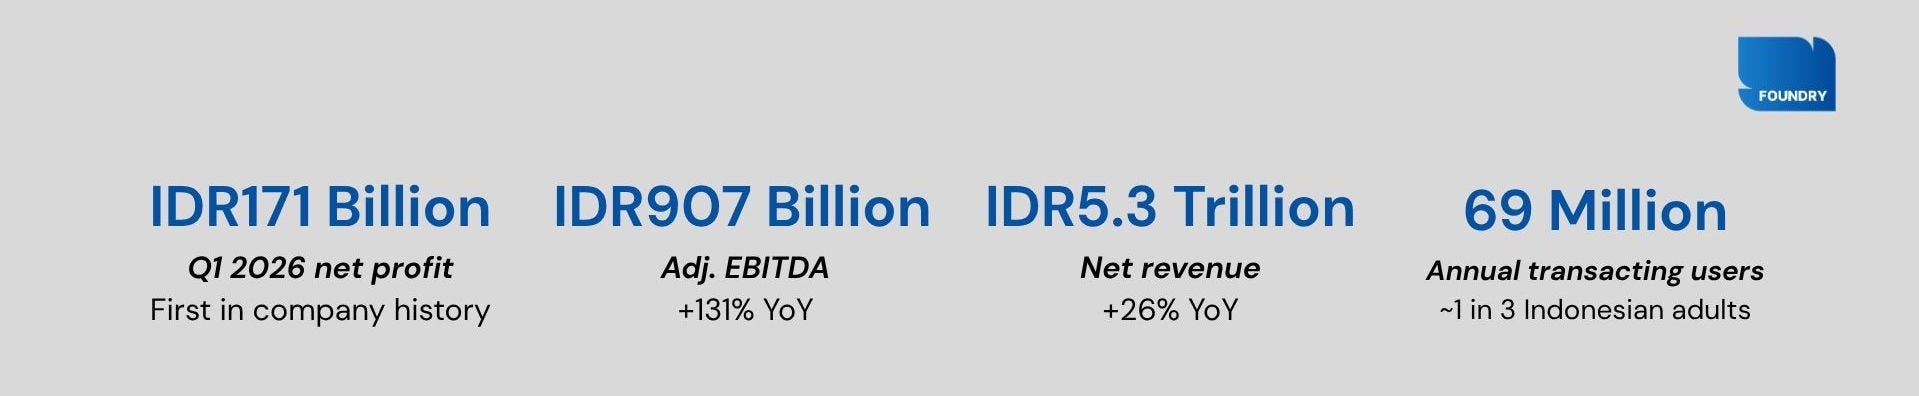
For the first time, GoTo reported a net profit: IDR 171 billion in Q1 2026. But this isn’t a one-quarter event. It’s the result of six consecutive quarters of compounding, built by turning its existing ride-hailing and food delivery users into financial services customers before any competitor could.
It didn’t happen alone. In the same 90 days, Bukalapak made a deliberate exit from a category it couldn’t win — physical goods — and redirected everything into virtual gaming, where margins are structurally higher and customers return on their own schedule. The EBITDA line turned positive for the first time. Fore Coffee opened outlets in cities its competitors hadn’t entered yet, kept discounts off the table, and grew net profit 60.5% during Ramadan, the hardest quarter on the Indonesian F&B calendar. Blibli deepened its grip on institutional clients until the revenue they generated outpaced what it cost to serve them for the fourth consecutive year.
Below the listed cohort, two pre-IPO companies that most of the market hasn’t looked at closely yet have been running profitably for over a year. Hypefast built one shared infrastructure layer and put multiple brands on top of it, so every new brand makes the whole system more efficient, not more expensive. CARDS embedded itself into the daily financial flows of 700 schools and now earns on every canteen transaction, not just the annual subscription. Neither is waiting for a listing to prove the model works.
Six results in 90 days. Six different operating mechanics. One direction.
GoTo
The fintech layer built inside the platform just outearned on-demand.
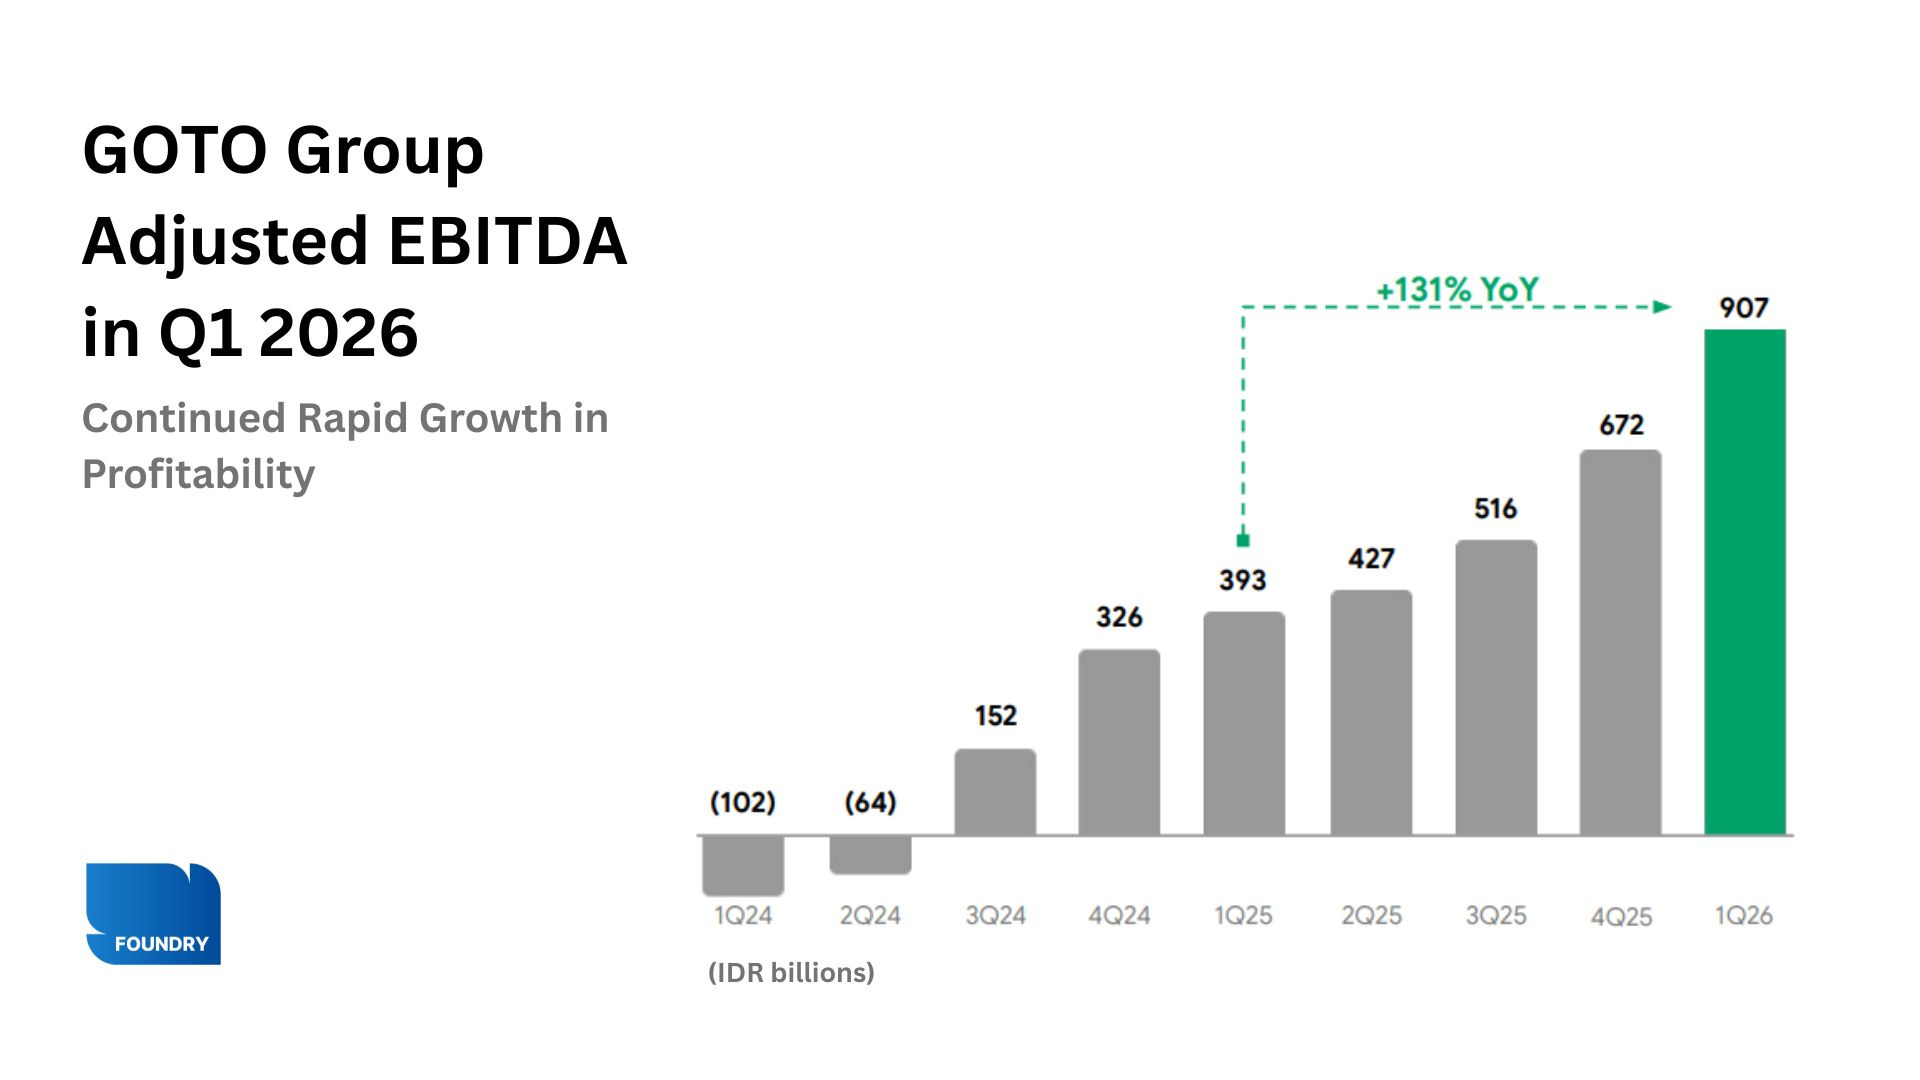
The fintech layer GoTo built inside its platform, on top of the users it had already acquired through ride-hailing and food delivery, now produces more EBITDA than on-demand services. Six consecutive quarters of compounding made that possible. No standalone neobank could have replicated the acquisition cost.
WHAT DROVE THE RESULT
Fintech outearned on-demand: Fintech EBITDA reached IDR 364B (+674% YoY) — the segment’s sixth consecutive profitable quarter. Monthly transacting users: 27.5M (+33%), supporting over 2 billion transactions.
The loan book scaled without risk creeping in: IDR 9.9T (+59% YoY), credit quality held. GoTo underwrites on transaction history it already owns, not external data.
On-demand held its ground: EBITDA IDR 439B (+40% YoY), seventh consecutive quarter of improvement, driven by product mix and pricing, not discounts.
Guidance held flat despite outperformance: Full-year EBITDA target unchanged at IDR 3.2–3.4T, management chose discipline over headline-raising.
GoTo didn’t build a separate fintech business. It converted the users it already had at a cost. That’s the moat, and it’s now visible in the numbers.
Bukalapak
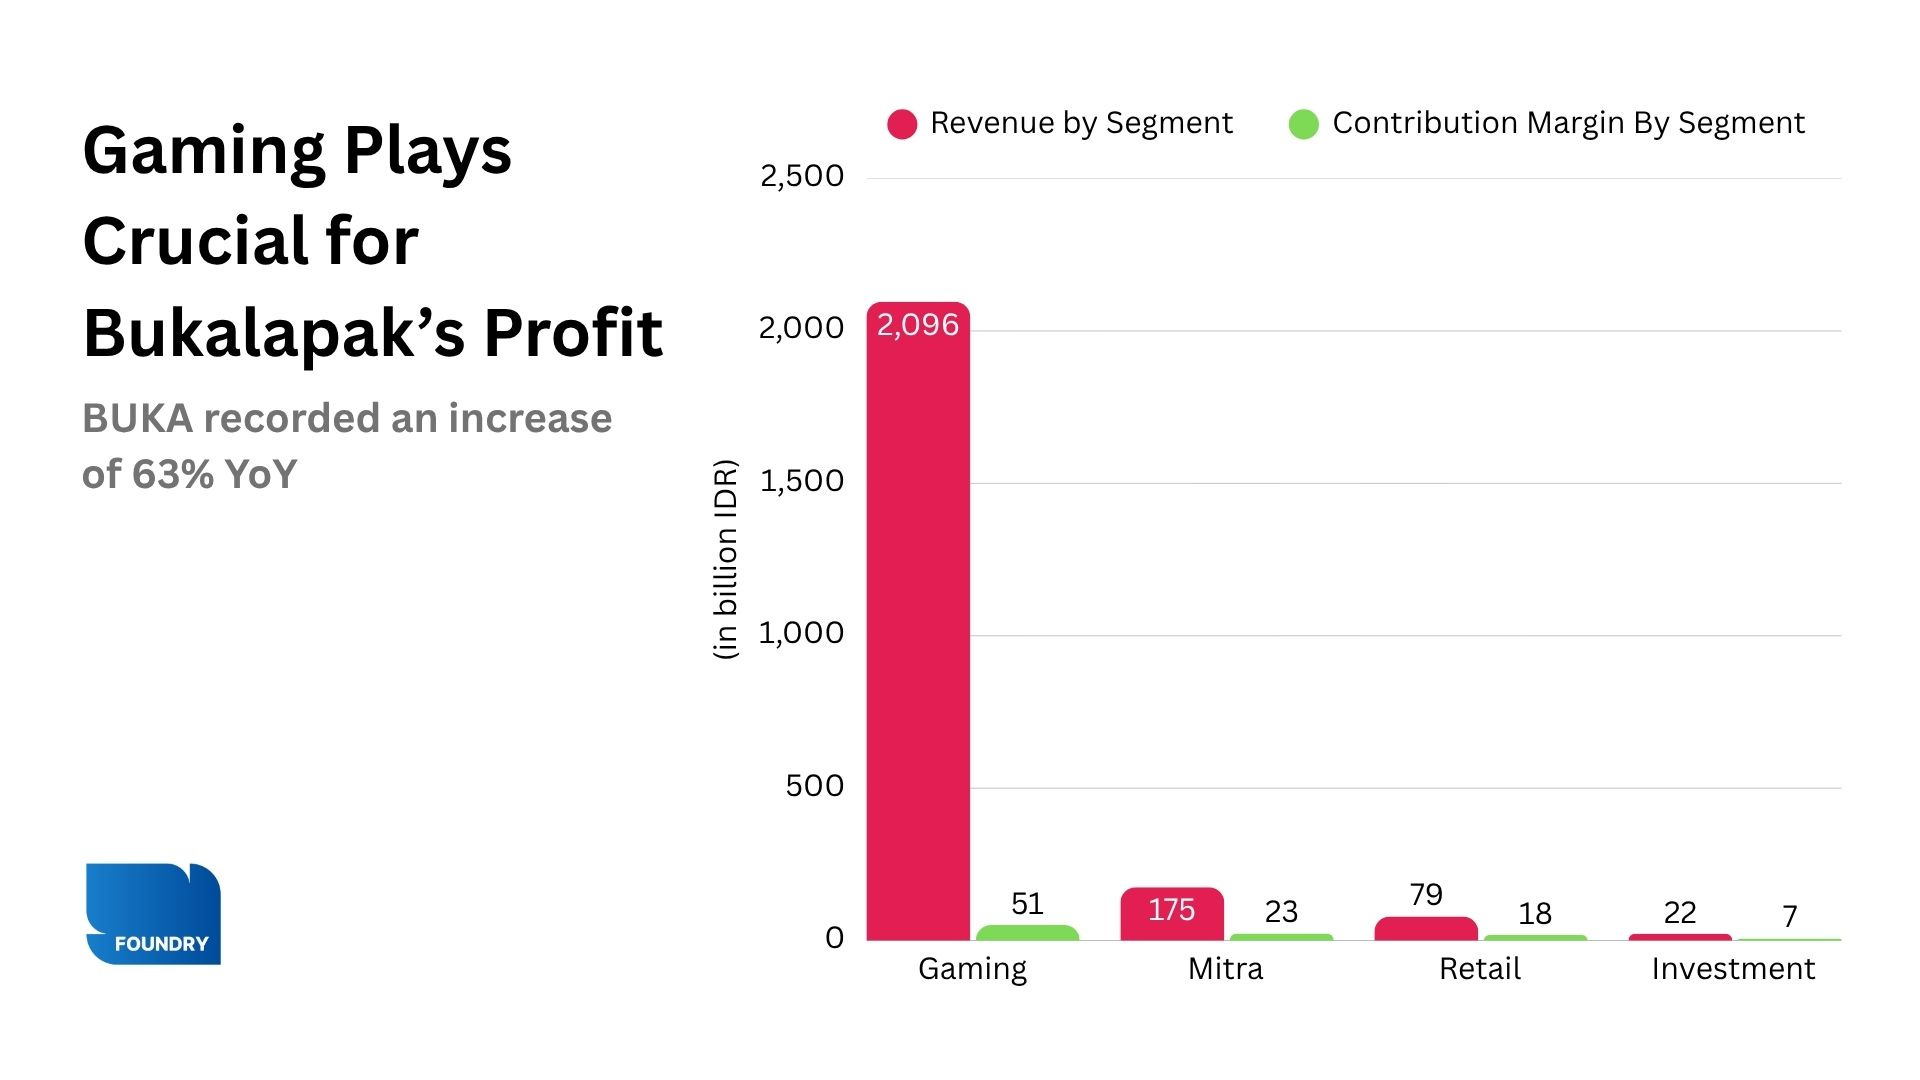
Virtual goods now drive 88% of revenue. The margin followed.
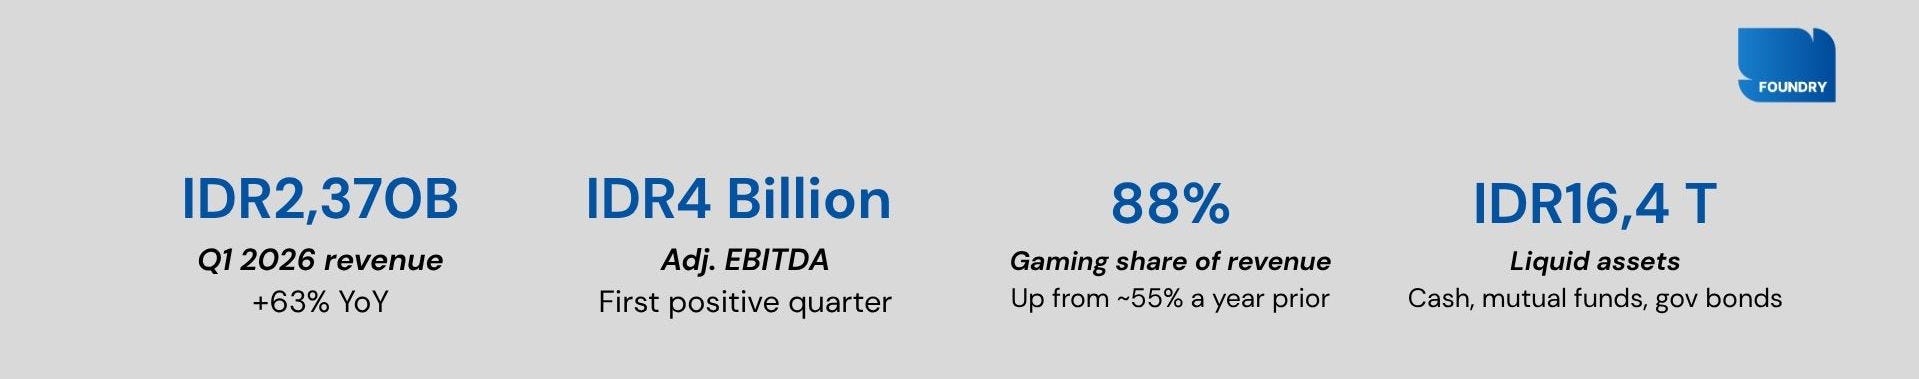
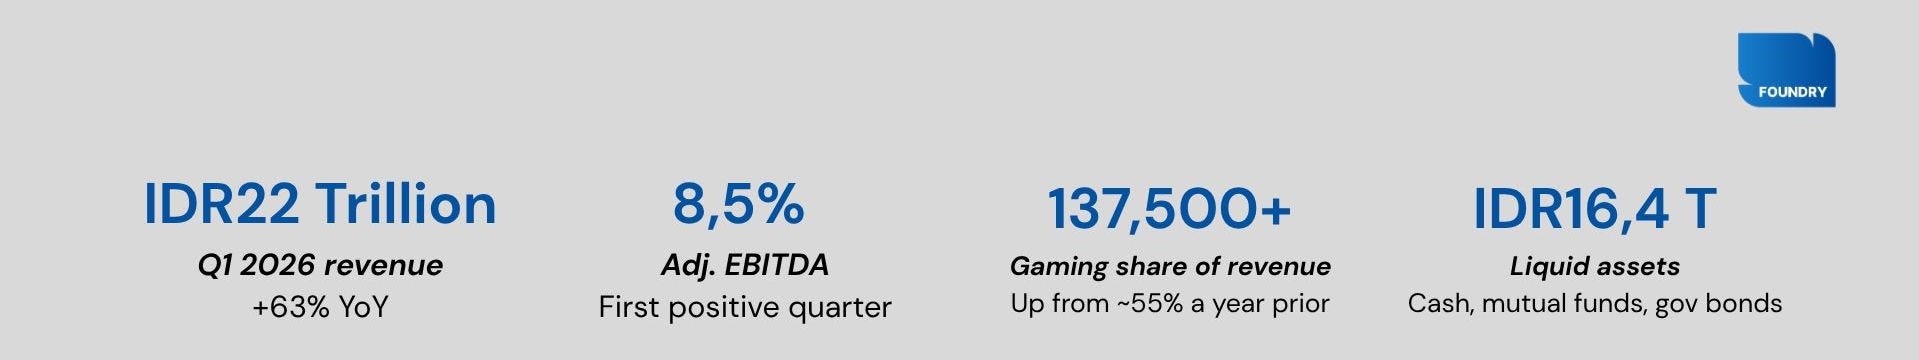
The exit from physical goods wasn’t a retreat. It was a reallocation. Virtual gaming products carry structurally higher margins, require no logistics, and bring customers back on their own schedule. Bukalapak concentrated there, held costs flat, and let the mix shift do the work.
WHAT DROVE THE RESULT
Gaming became the engine: Itemku and Lapakgaming generated IDR 2,096B — up 90% YoY. Gaming EBITDA more than doubled to IDR 29B (+101% YoY). Virtual goods carry higher margins, don’t require logistics, and customers return on their own schedule.
Costs held flat as revenue grew: Operating expenses held at IDR 95B while revenue grew 63%. EBITDA turned positive through cost discipline, not a revenue spike.
Mitra shed its low-margin revenue: Revenue fell 33% YoY but contribution margin improved from 9.2% to 13.1%. What was left was the part dragging returns down.
B-Money compounding quietly: IDR 22B revenue at 34.3% contribution margin, up 75% YoY.
Note on reported net loss: The IDR 424B net loss reflects mark-to-market losses on investments including Allo Bank (non-cash, non-operational). Adjusted EBITDA is the cleaner read.
The mix shift that began in FY2025 is now producing operating leverage. Gaming at 88% of revenue and EBITDA turning positive in the same quarter is the confirmation.
Fore Coffee
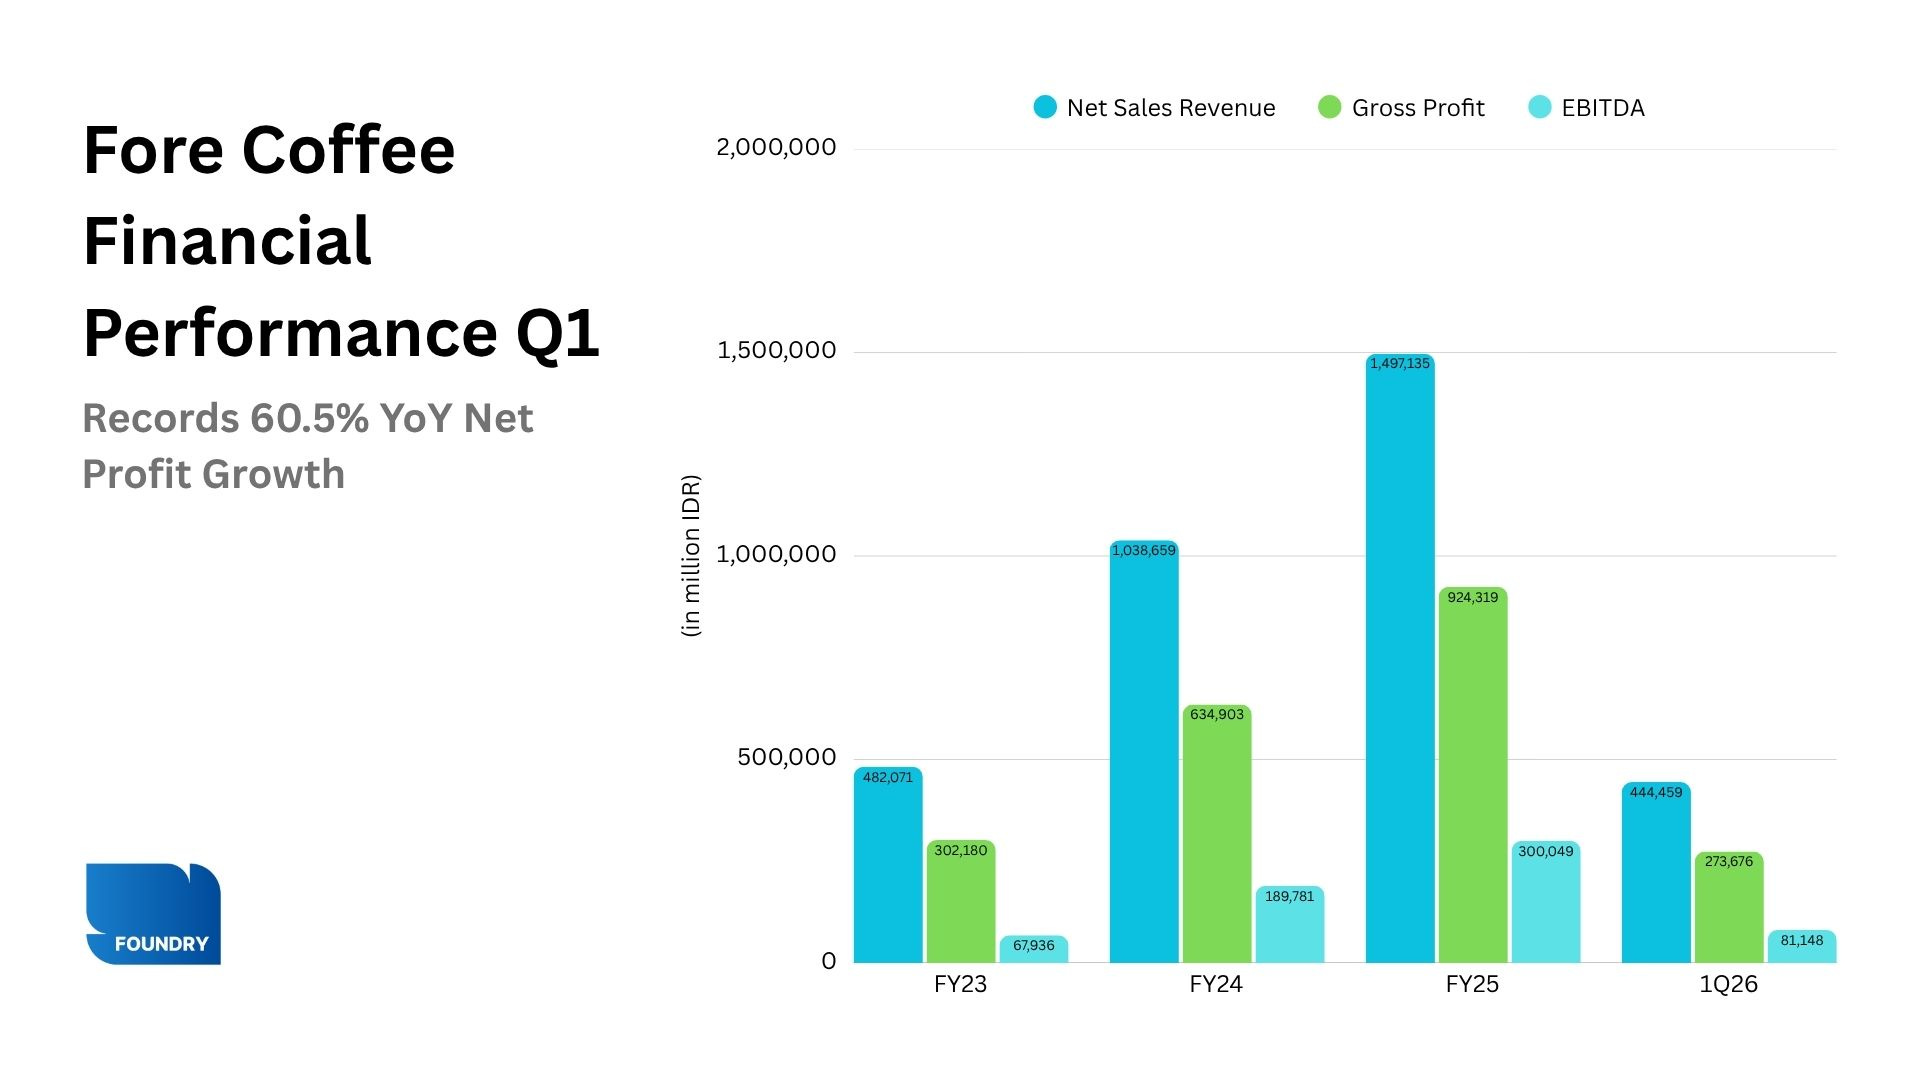
Tier-2/3 cities are where the margins are, and Fore Coffee got there first.
The geography was the strategy. Tier-2/3 cities offer lower rent, thinner competition, and customers with fewer premium alternatives, which means pricing power holds. Fore Coffee built its expansion there, kept promotions off the table, and posted its strongest profit growth during the calendar’s weakest quarter.
WHAT DROVE THE RESULT
Geography drove the margin: Tier-2/3 cities offer lower rent, lower customer acquisition costs, and pricing power that holds. Fewer premium alternatives means customers pay full price.
Profit outgrew revenue: Net profit +60.5% vs. revenue +52.4% — the marginal outlet earns more than the average. No increase in promotions in Q1.
Second brand, same infrastructure: Fore Donut opened 5 outlets in Q1 (airports, Bandung, Surabaya) using Fore Coffee’s existing supply chain, store tech, and operations. No separate team, no separate overhead.
Seasonality didn’t slow it: Ramadan consistently softens Indonesian F&B. Fore Coffee posted 60.5% profit growth inside that headwind.
Margin expanded alongside a 35% network expansion because the new outlets were built in markets where expansion improves the economics, not just the footprint.
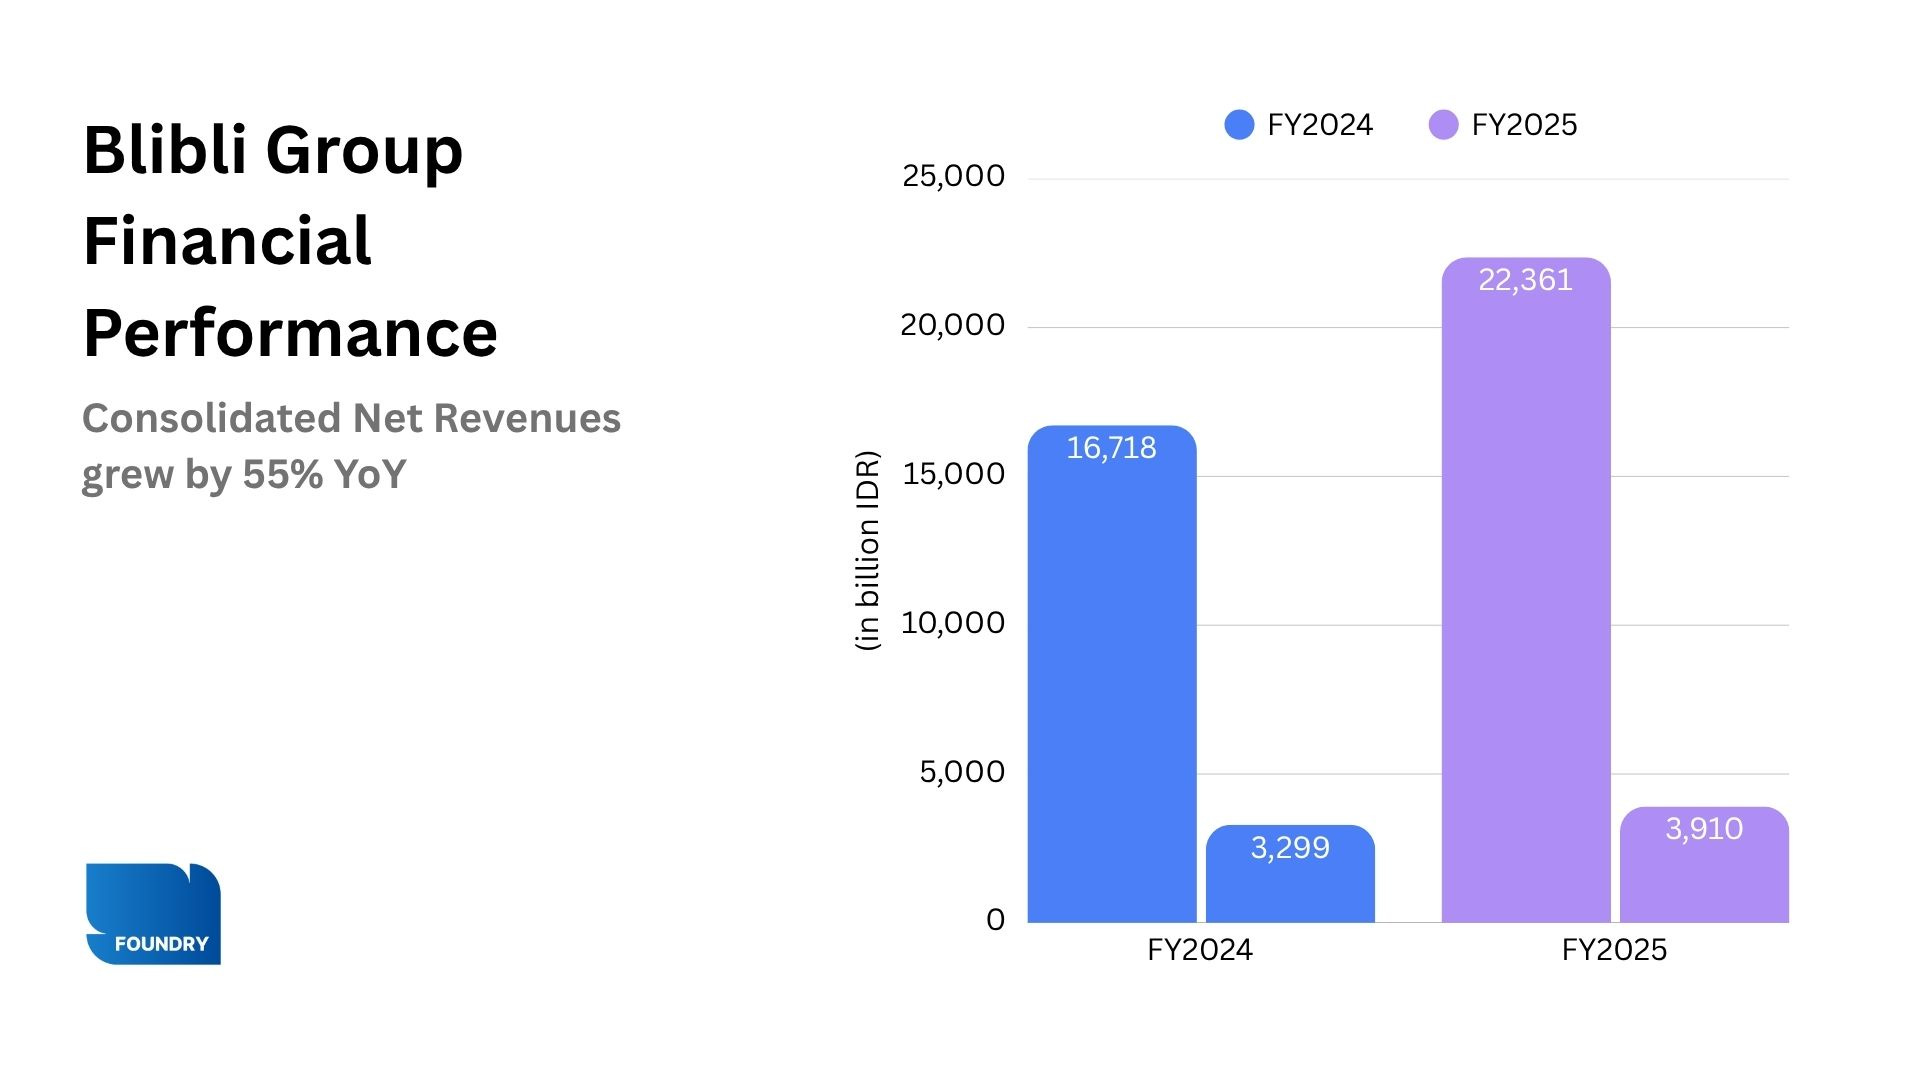
Blibli
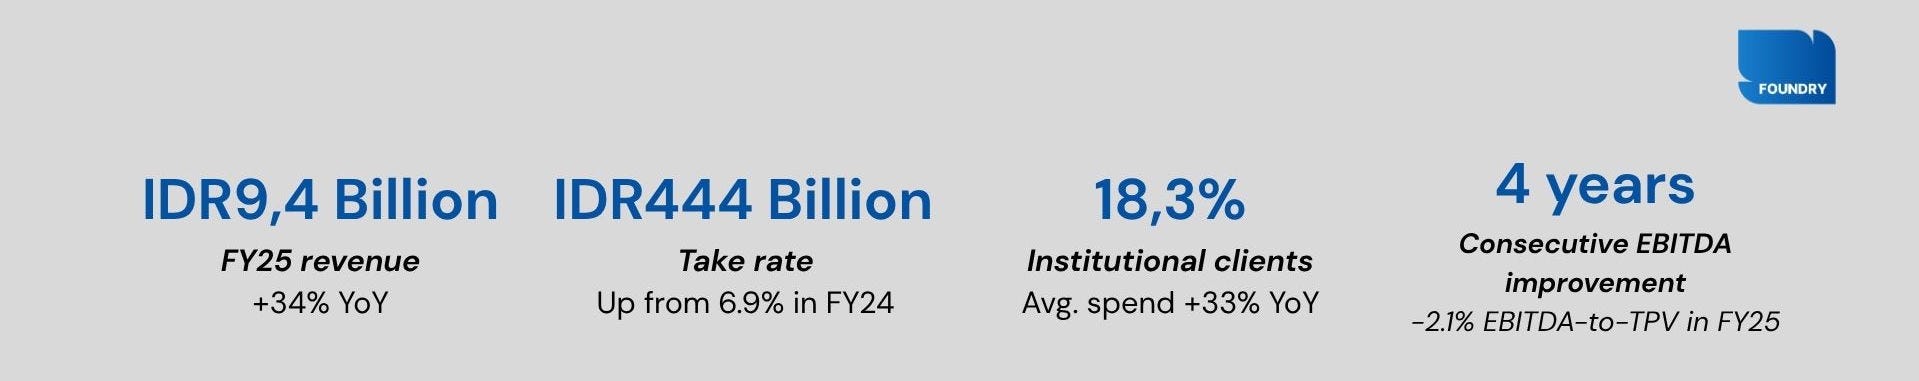
Four consecutive years of take rate expansion. The institutional client is why.
Blibli didn’t grow take rate by charging more. It grew take rate by shifting who it serves and how deeply it monetises them. Institutional clients buy in volume, return on contract, and are more rational on price. Moving more of them onto revenue-generating services is what moved the number, 160 basis points in twelve months, four years running.
WHAT DROVE THE RESULT
Institutional monetisation moved from 49% to 59%: More of the client base now sits on services that generate revenue, not just transaction volume. Institutional buyers are stickier, more predictable, and return on contract.
Category mix did the structural work: Gross profit before discounts grew 32% YoY, exceeding revenue growth, because higher-margin categories (smartphones, home & living, institutional procurement) gained share.
Cost base tightened in the right places: Operating expenses as a share of total payment volume fell from 7.4% to 7.1%, with cuts in advertising and admin, not in customer service infrastructure.
Physical network serves the ecosystem: 269 consumer electronics stores, 57 Ranch Market locations, 39 Dekoruma centers. Touchpoints that feed loyalty and data, not standalone retail.
Take rate has improved every year for four years. The relationship between revenue growth and margin improvement is now measurable in consistent annual increments.
The Next Wave: Early Stage Companies Are Building Profit Before the Bell
The pattern extends below the listed cohort:
Two companies at a meaningfully smaller scale have been operating profitably for a year or longer. Both ahead of their listing targets, both through models that get more efficient as they grow.
Hypefast
One infrastructure layer, many brands — EBITDA positive three years before the IPO target.
Most multi-brand operators build each brand separately: separate logistics, separate tech, separate overhead. Hypefast built the platform first and added brands on top. The fixed cost is already paid. Every brand that follows compresses per-brand cost rather than adding to it.
WHAT DROVE THE RESULT
EBITDA and free cash flow positive since 2024. Three years ahead of its mid-2027 IPO target.
In-house manufacturing and 10,000+ points of sale across Indonesia reduce marketplace dependency and protect margins.
~150 retail operators centralised at HQ run all brands from a single logistics, warehousing, and technology layer.
AI-enabled direct-to-consumer channels across every brand in the portfolio, on shared tech.
Per-brand cost declines as the portfolio grows. Profitability is structural, not incidental.
CARDS
A school SaaS that earns on every canteen transaction. Rule of 40: 53.1%.
A SaaS subscription covers the base. But CARDS then placed itself inside every financial transaction a school processes — fee collections, canteen sales, daily purchases — and earns a fee on each one. The school isn’t just a subscriber. It’s a transaction venue that renews itself every day.
WHAT DROVE THE RESULT
Rule of 40 score: 53.1% — combining solid growth with a ~20% net profit margin.
Transaction-fee revenue: grew 52.8% in 2025 and now contributes ~40% of monthly revenue, generated through SPP payments, canteen sales, and school purchases.
Gross transaction volume: +94% YoY — daily micro-transactions on a closed-loop system that wouldn’t exist in a pure SaaS model.
Partner schools: 700+ (+50% YoY), with average students per school up 20.7% — same-store volume growing alongside new additions.
LTV-to-CAC ratio: 11x — a function of high switching costs and captive daily transaction volume in a low-competition segment (Tier-2/3 cities, pesantren).
The hybrid model earns on the annual contract and on every transaction in between. That’s why a school SaaS is producing a 20% net margin.
The Pattern
These results didn’t arrive together by coincidence. Each company built its operating mechanism quietly, over quarters, sometimes years, before the numbers made it visible. The profitability shown in this 90-day window was earned well before the reporting window opened.
What’s significant is the breadth. This isn’t one sector having a good quarter, or one company finally turning a corner. It’s a ride-hailing app turned super app, an all-commerce platform, an F&B chain, an omnichannel retailer, a multi-brand consumer goods platform, and a school edtech. All moving in the same direction, at the same time, through entirely different means.
GoTo’s IDR 171 billion is one number in a much larger set. The set is what changed — and it’s larger than any single quarter can contain.